2023 SAT Results: Back for a second year, how are students at different schools performing?

Last week, the State Board of Education released SAT college readiness rates for Indiana juniors who take the test as a graduation requirement. This is only the second year that the SAT is the required high school assessment for juniors in Indiana. We know that students are more than their standardized test scores. However, analyzing assessment data provides insight on student progress and can highlight opportunities for school improvement. The SAT data, in particular, provides our community another window into how students from different high schools are performing.
2023 Statewide Progress: College Readiness Varies Depending on School Type
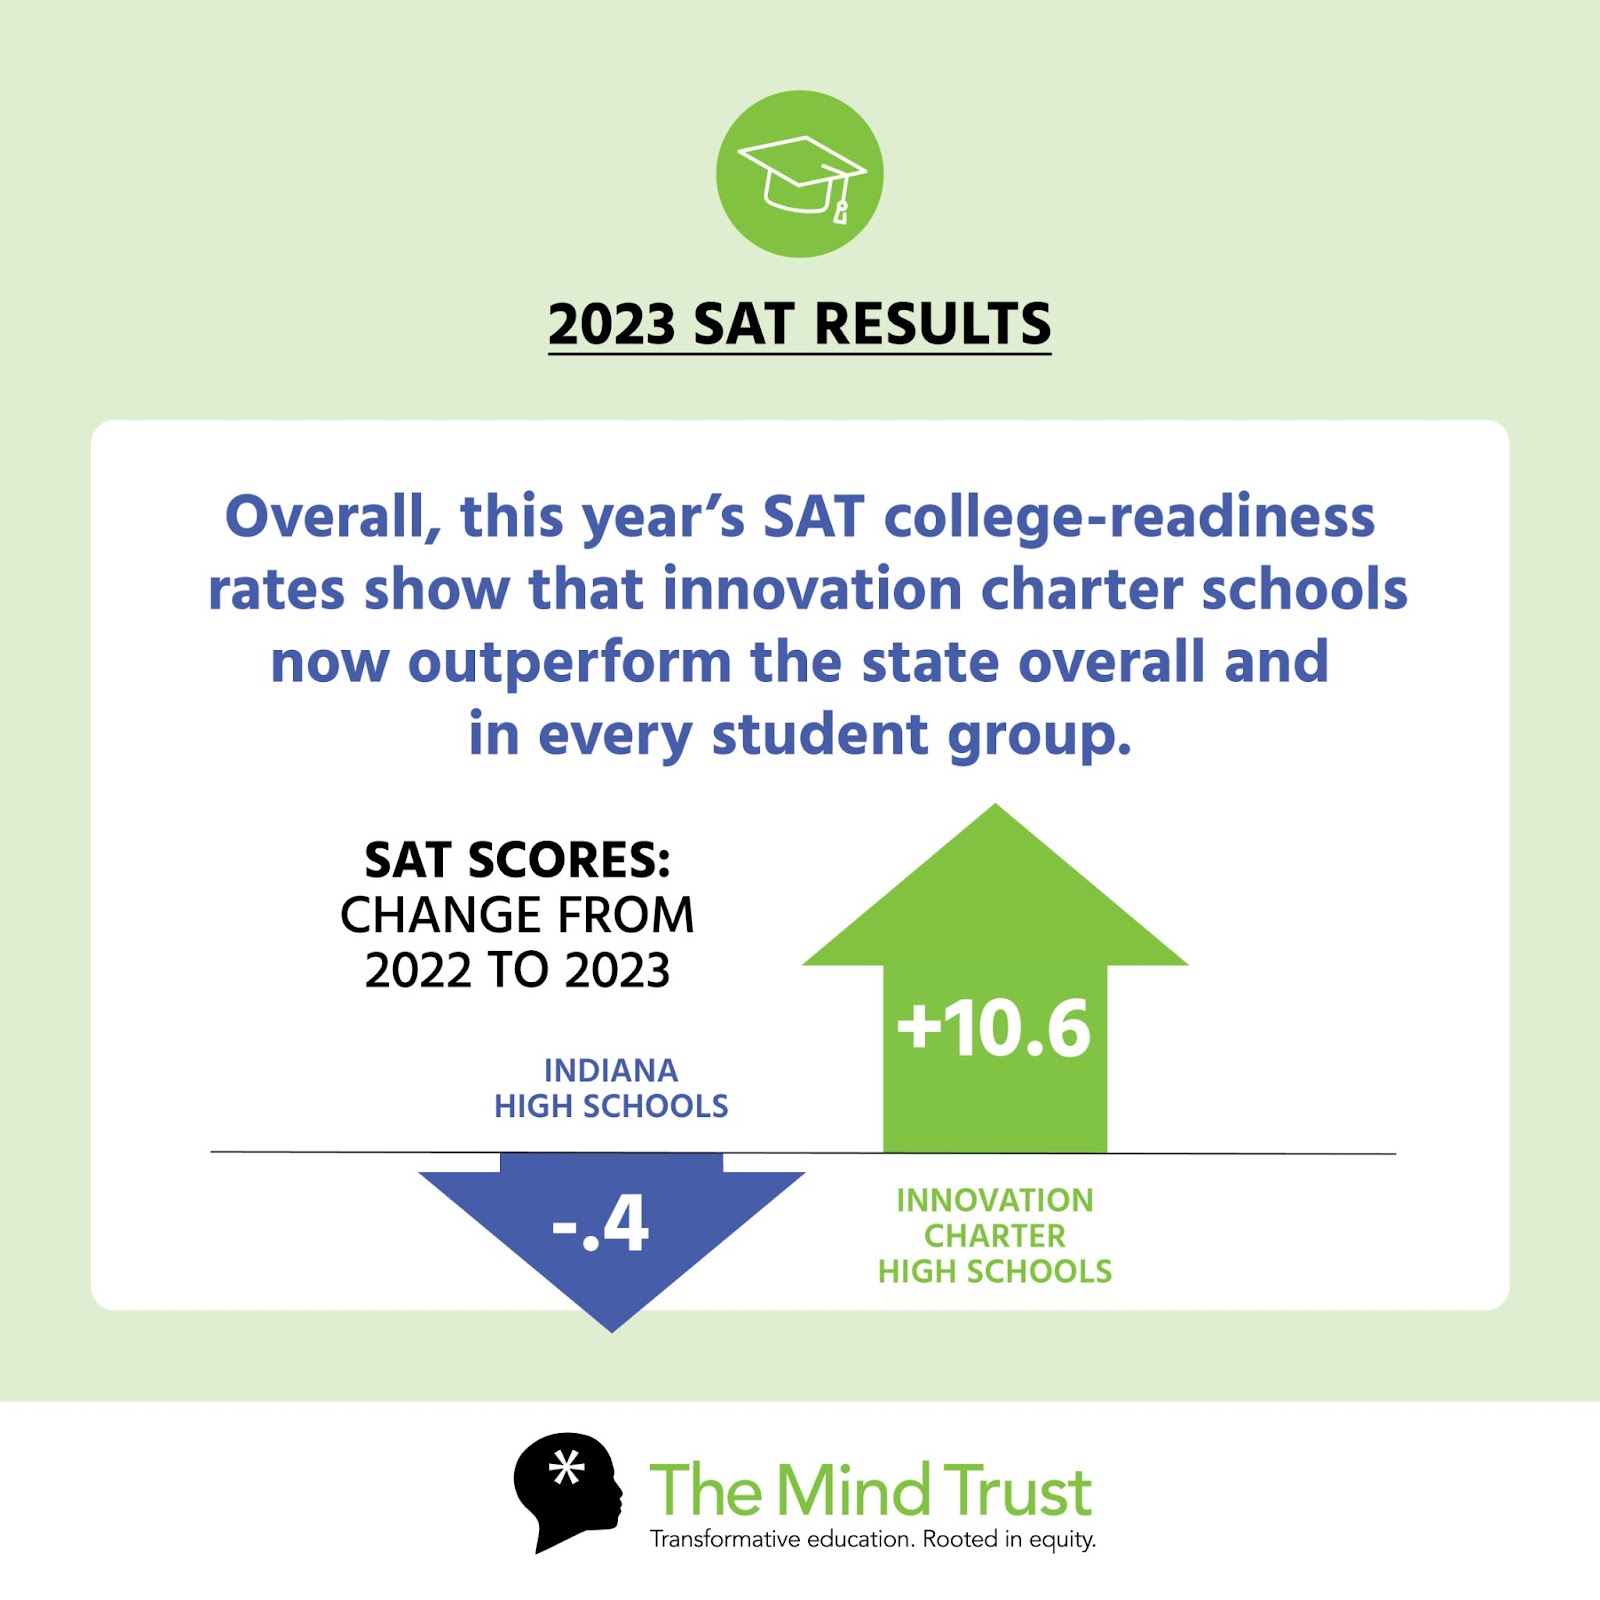
Statewide, the percentage of students achieving college readiness benchmarks on both the math and Evidence-Based Reading and Writing (EBRW) sections decreased by 0.4 points overall, decreased by 0.6 points for Black students, decreased by 0.1 points for Hispanic students, and increased by 0.2 points for low-income students. In Indianapolis, township districts saw college readiness rates on both SAT sections decrease by 1.4 points overall, decrease by 1.7 points for Black students, decrease by 2.4 points for Hispanic students, and decrease by 0.4 points for low-income students.
Conversely, this year students attending Indianapolis charter high schools increased their college-readiness rates on both sections of the SAT by 6.0 points overall, 1.6 points for Black students, 7.0 points for Hispanic students, and 1.9 points for low-income students. Specifically, innovation charter schools increased college-readiness rates by 10.6 points overall, 2.6 points for Black students, 11.6 points for Hispanic students, and 5.4 points for low-income students. Special education students attending charter high schools improved their college-readiness rates by 6.4 points.
Innovation charter schools now outperform the state overall and on every student group.
Indiana SAT scores highlight Indianapolis charter and Innovation school students’ college-readiness
| Passing Both ELA & Math, 21-22 to 22-23 | Overall | Latino | Black | FRL | SPED |
|---|---|---|---|---|---|
| All Charters | 6.0% | 7.0% | 1.6% | 1.9% | 6.4% |
| Innovation Charters | 10.6% | 11.6% | 2.6% | 5.4% | 9.7% |
| IPS | 0.1% | 1.3% | -1.3% | 0.6% | -0.8% |
| Townships | -1.4% | -2.4% | -1.7% | -0.4% | 0.0% |
| State | -0.4% | -0.1% | -0.6% | 0.2% | 0.2% |
Chart: Proficiency point changes from the 2021-2022 to the 2022-2023 school year.
*Township data includes the proficiency rate for students who attend the ten Marion County townships school districts that surround IPS.
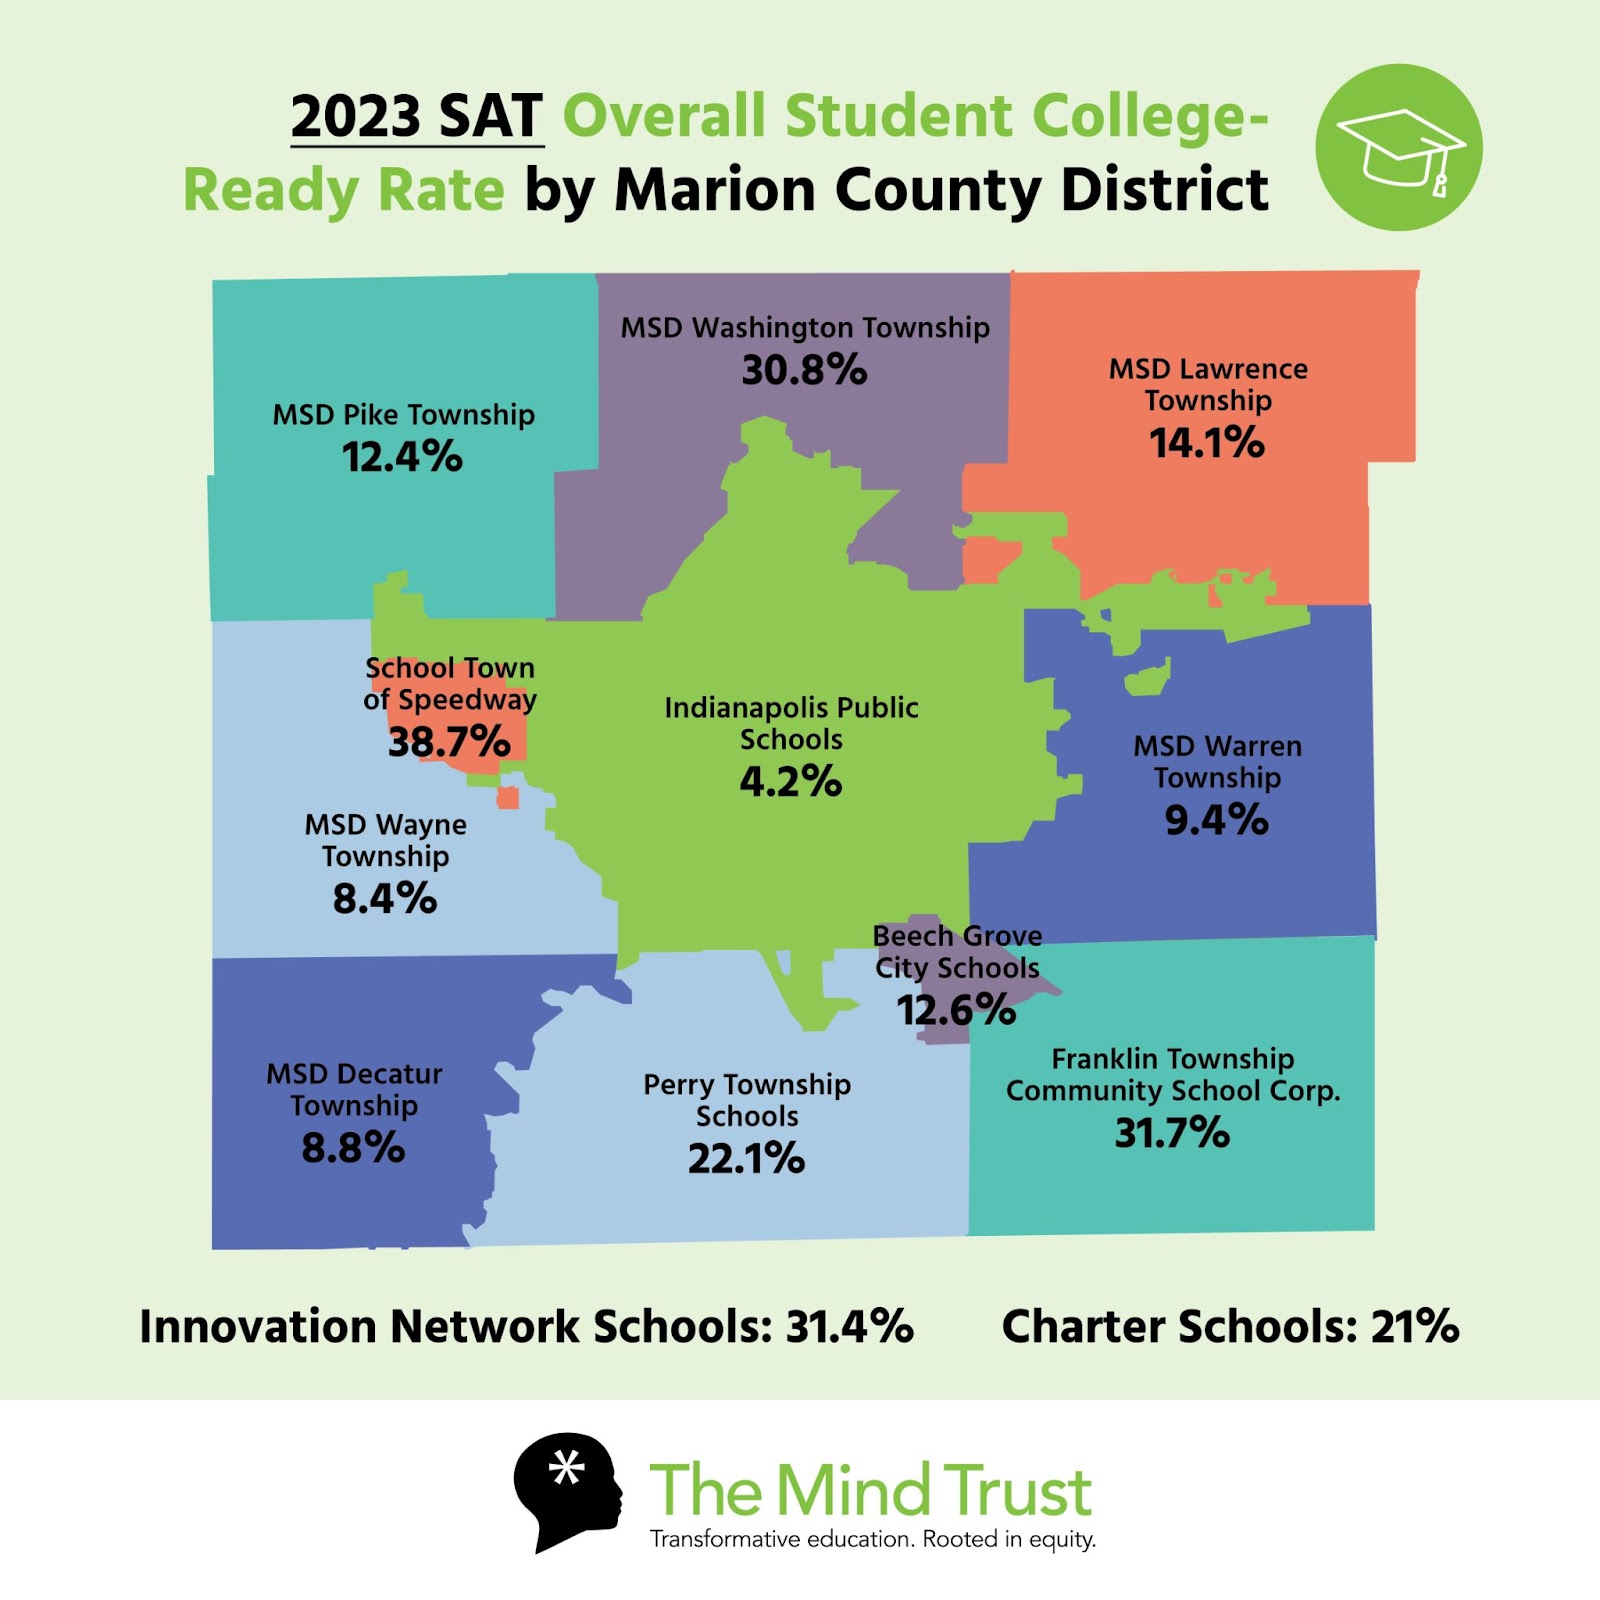
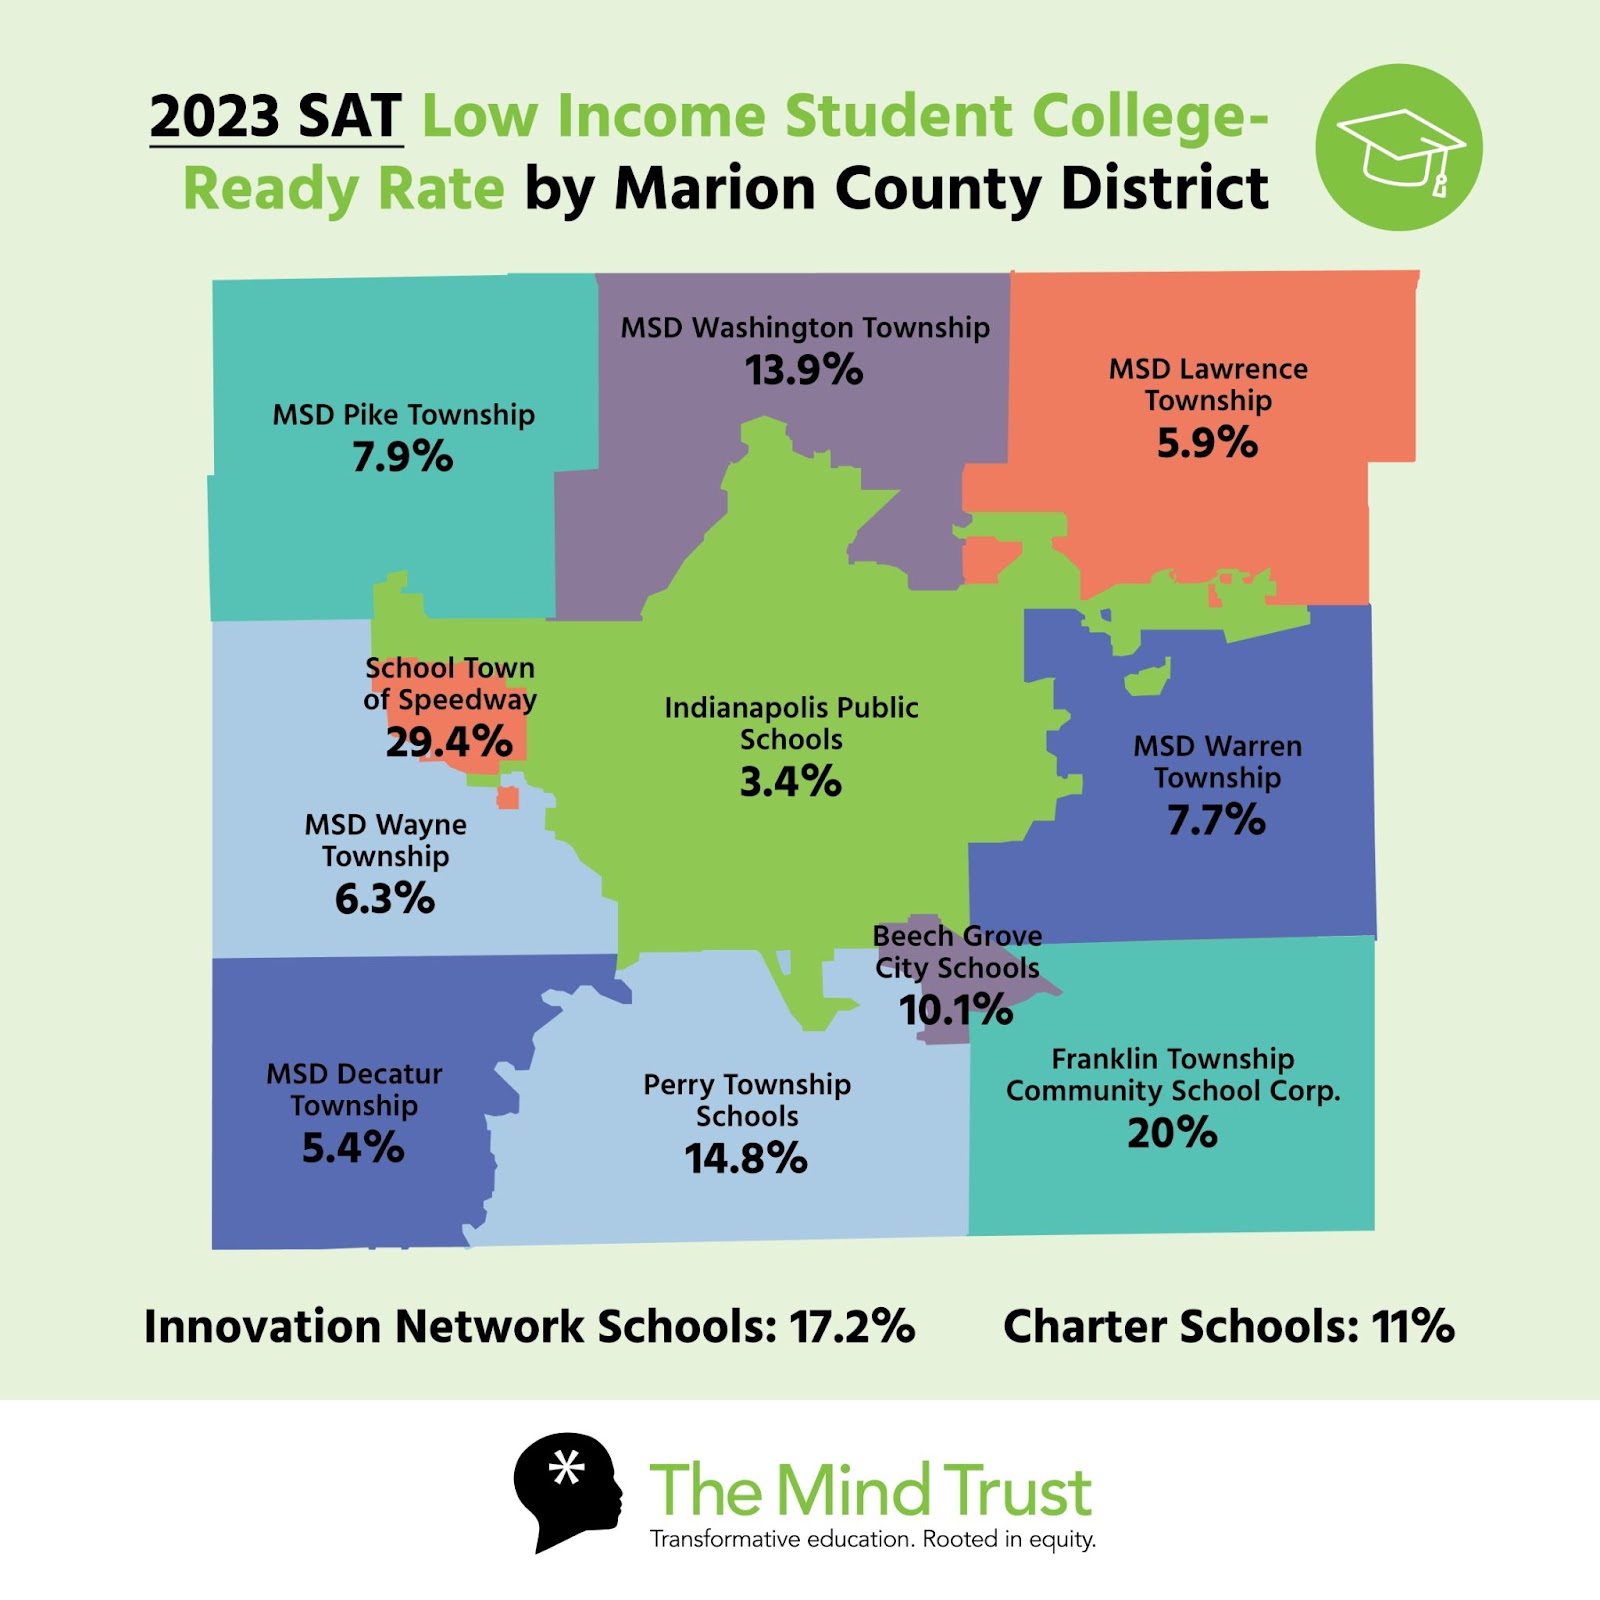
2023 Marion County: College Readiness Varies Depending on School Type
The data shows how Indianapolis charter and Innovation schools are continuing to serve students well despite decreases at the state level and across Marion county. Families, recognizing this, are choosing to send their children to autonomous schools at growing rates.
There are almost 150,000 Marion county students enrolled in preschool through 12th grade. Charter and innovation schools serve over 24,000 of those students across 68 schools, 45 of which were launched with support from The Mind Trust. When looking at high school-aged students, 6,000 of the 24,000 public school students in Marion County attend a charter or innovation school.
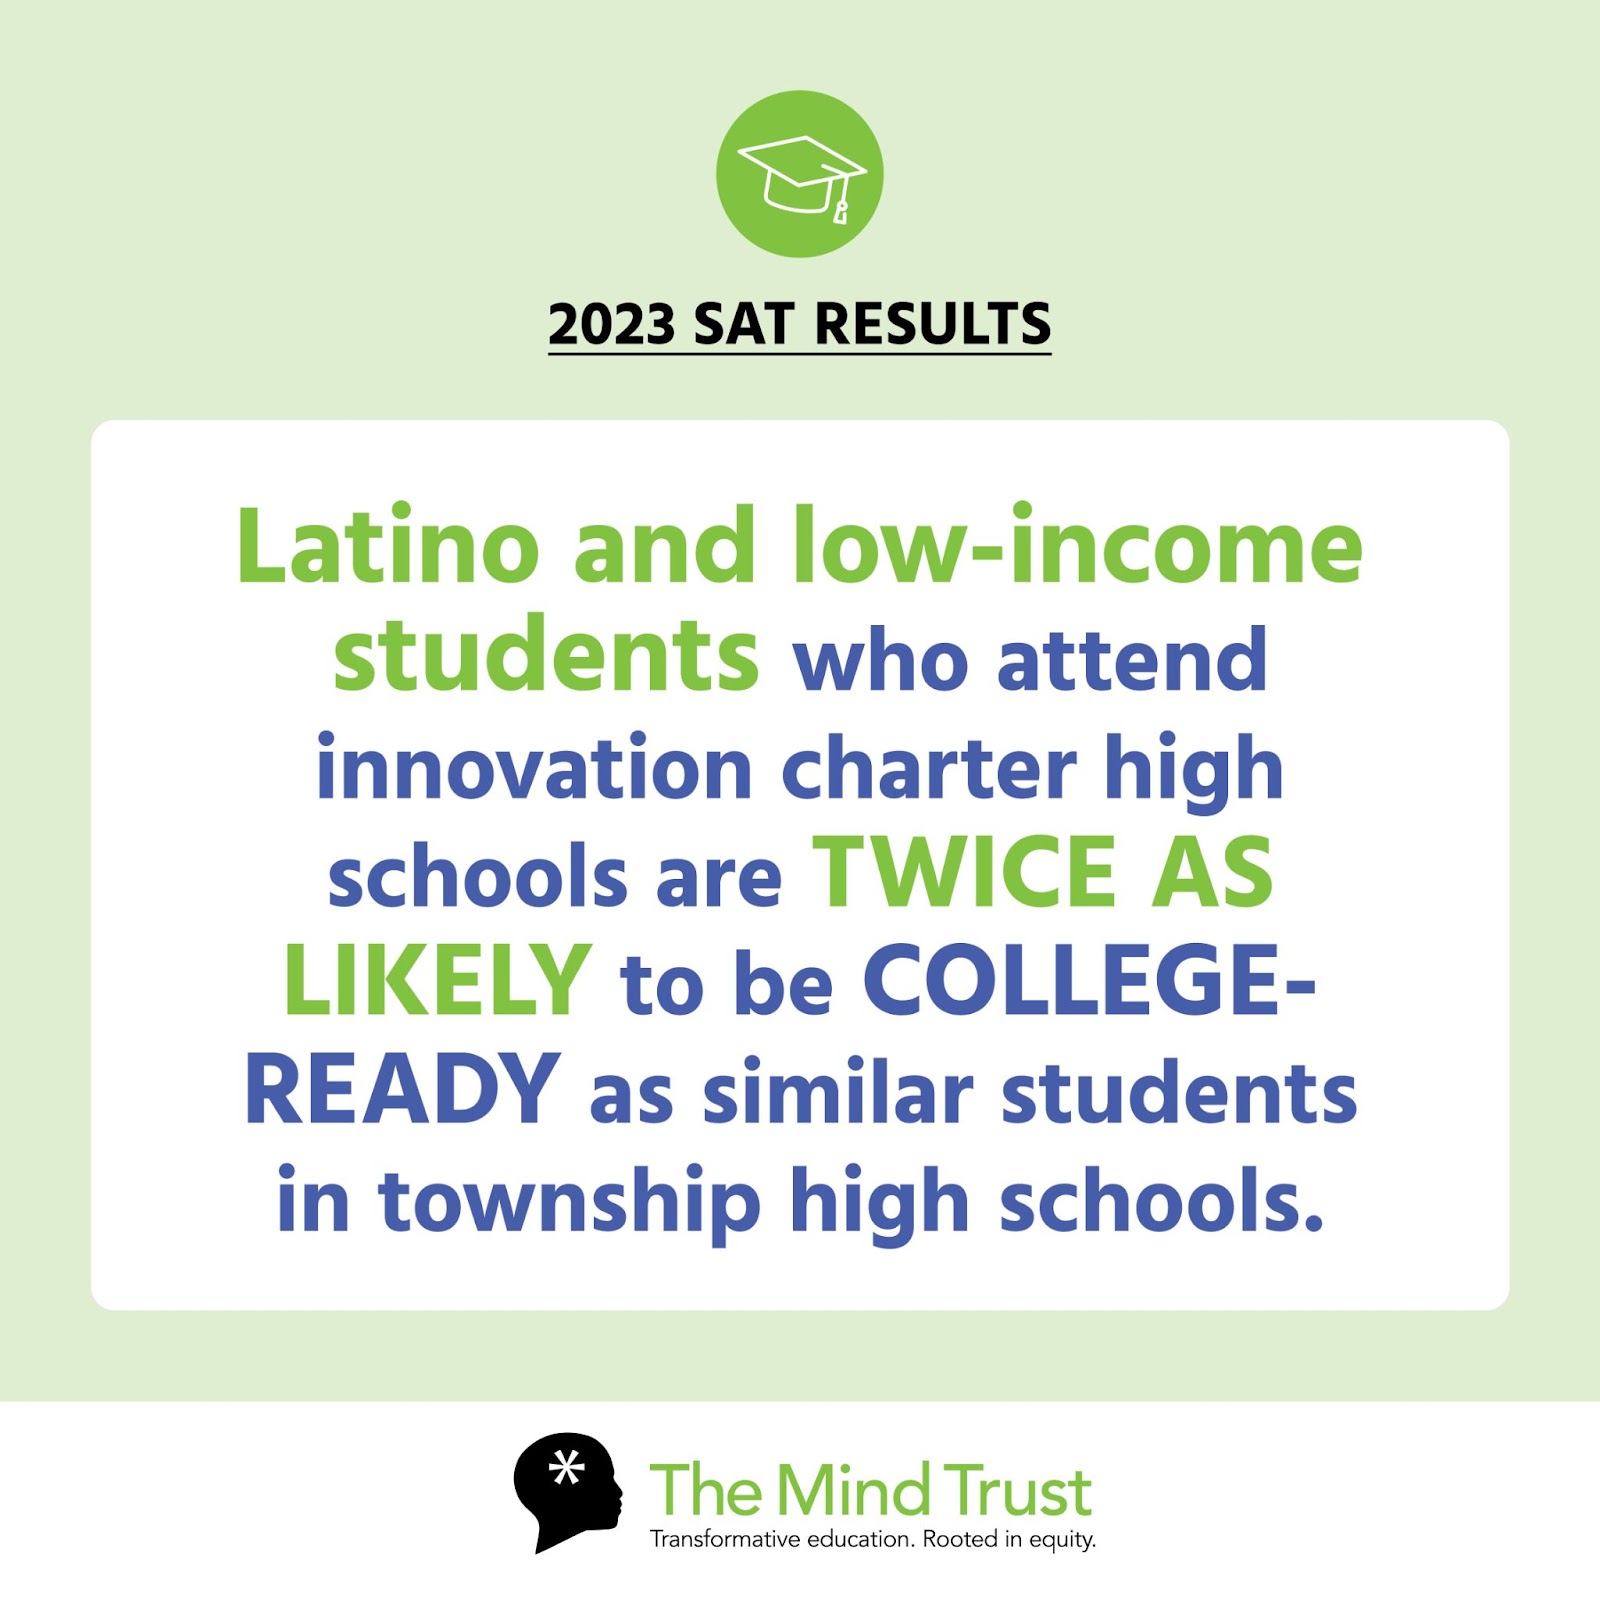
These schools not only provide innovative options for Indianapolis families, they are also consistently some of the best schools in the city and state when it comes to academic outcomes for Black, Latino, and low-income students.
Below you can find SAT college readiness rates for various Marion County school districts.

Highlighting Indianapolis charter schools
Black, Latino, and low-income students who attend charter and innovation schools continue to show outsized progress when compared to district-managed schools.
Schools with the highest college readiness rates within IPS boundaries:
- Overall, 9 of the top 10 public high schools within IPS boundaries are charter and innovation schools
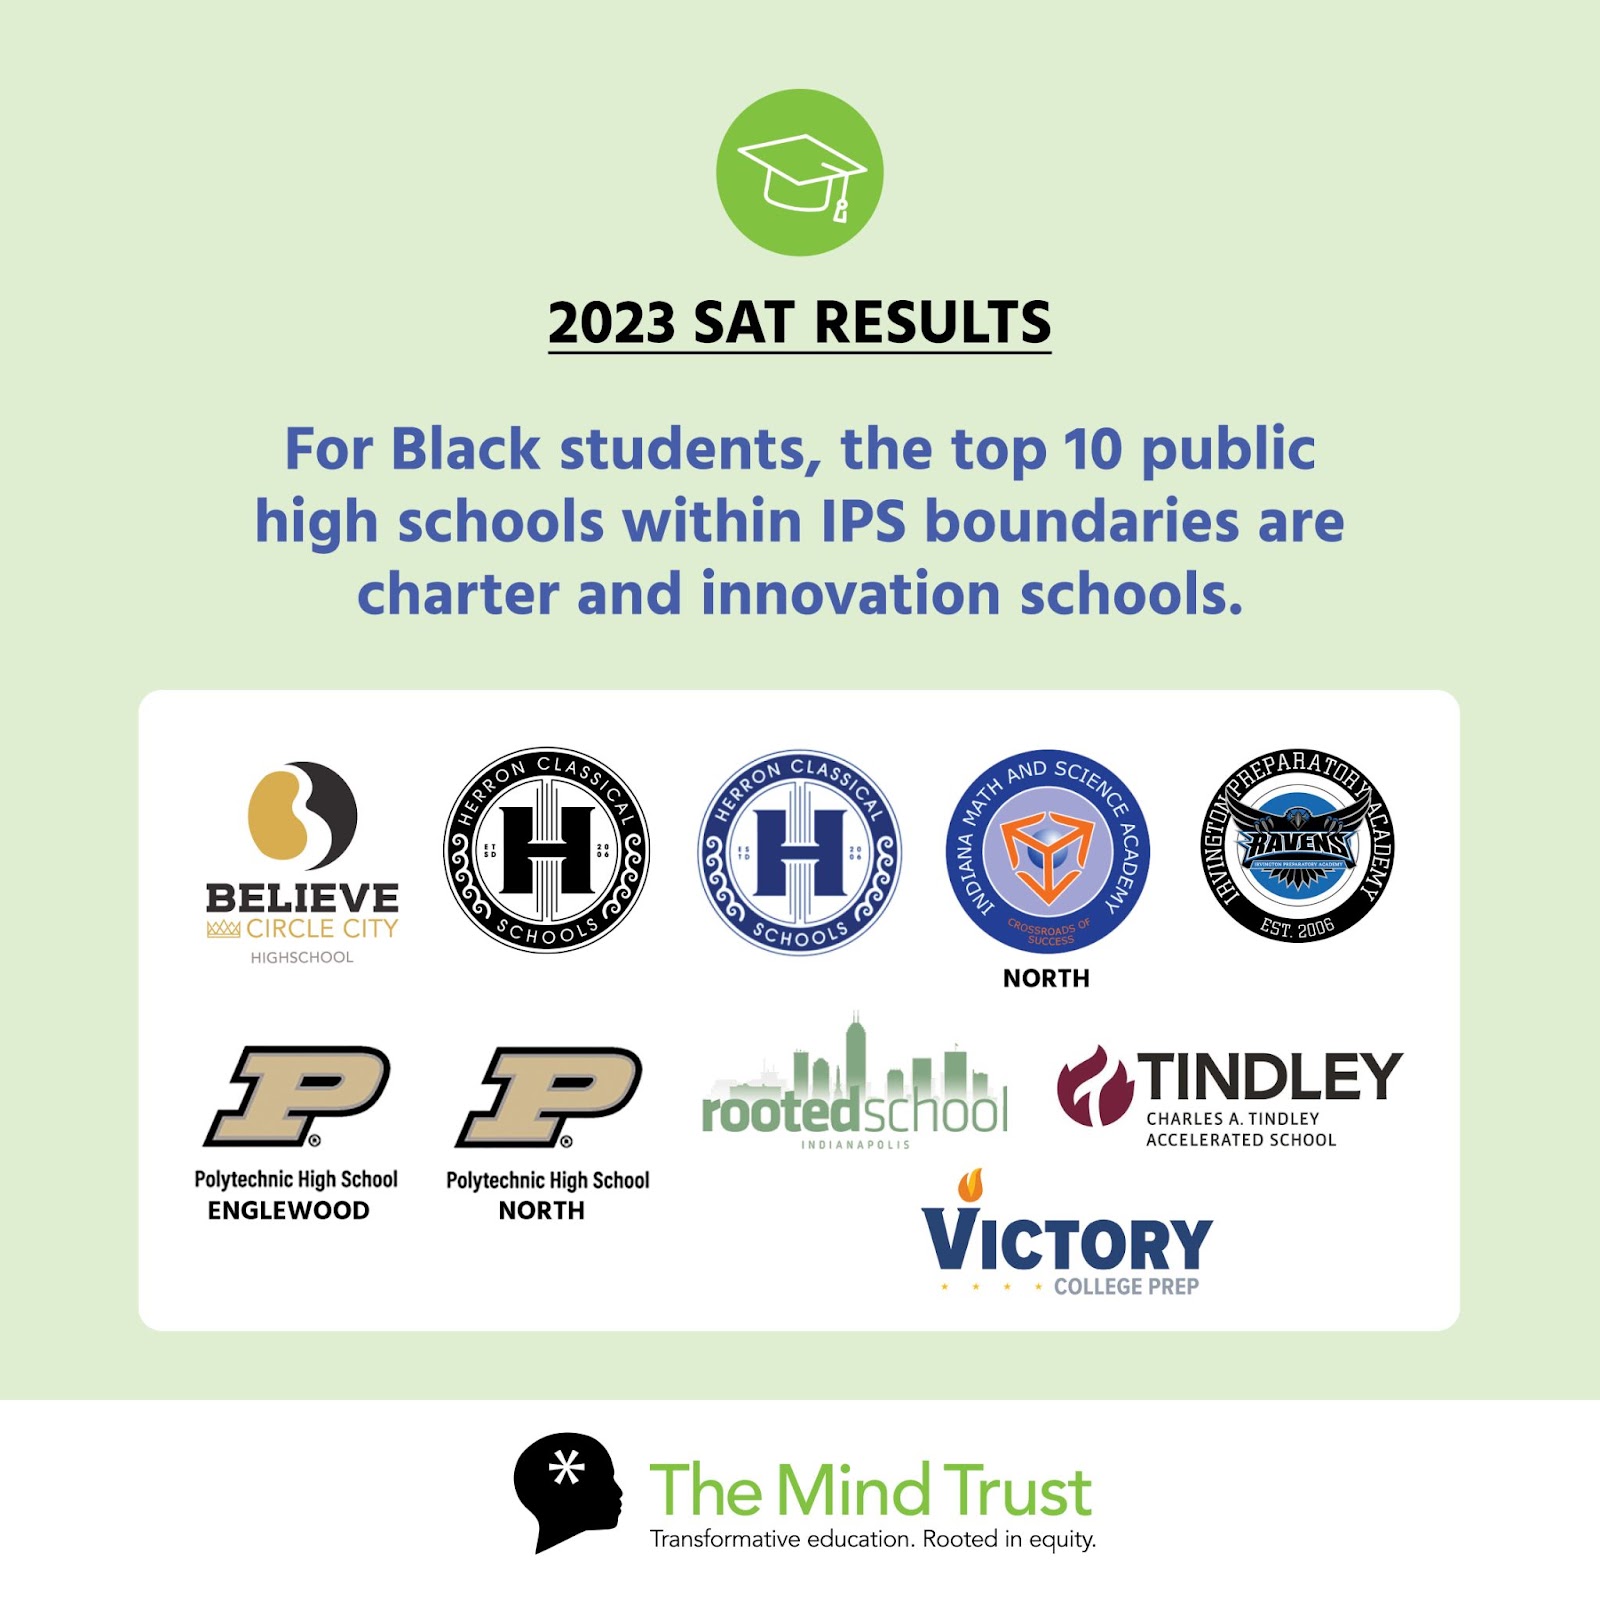
- For Black students, the top 10 public high schools within IPS boundaries are charter and innovation schools
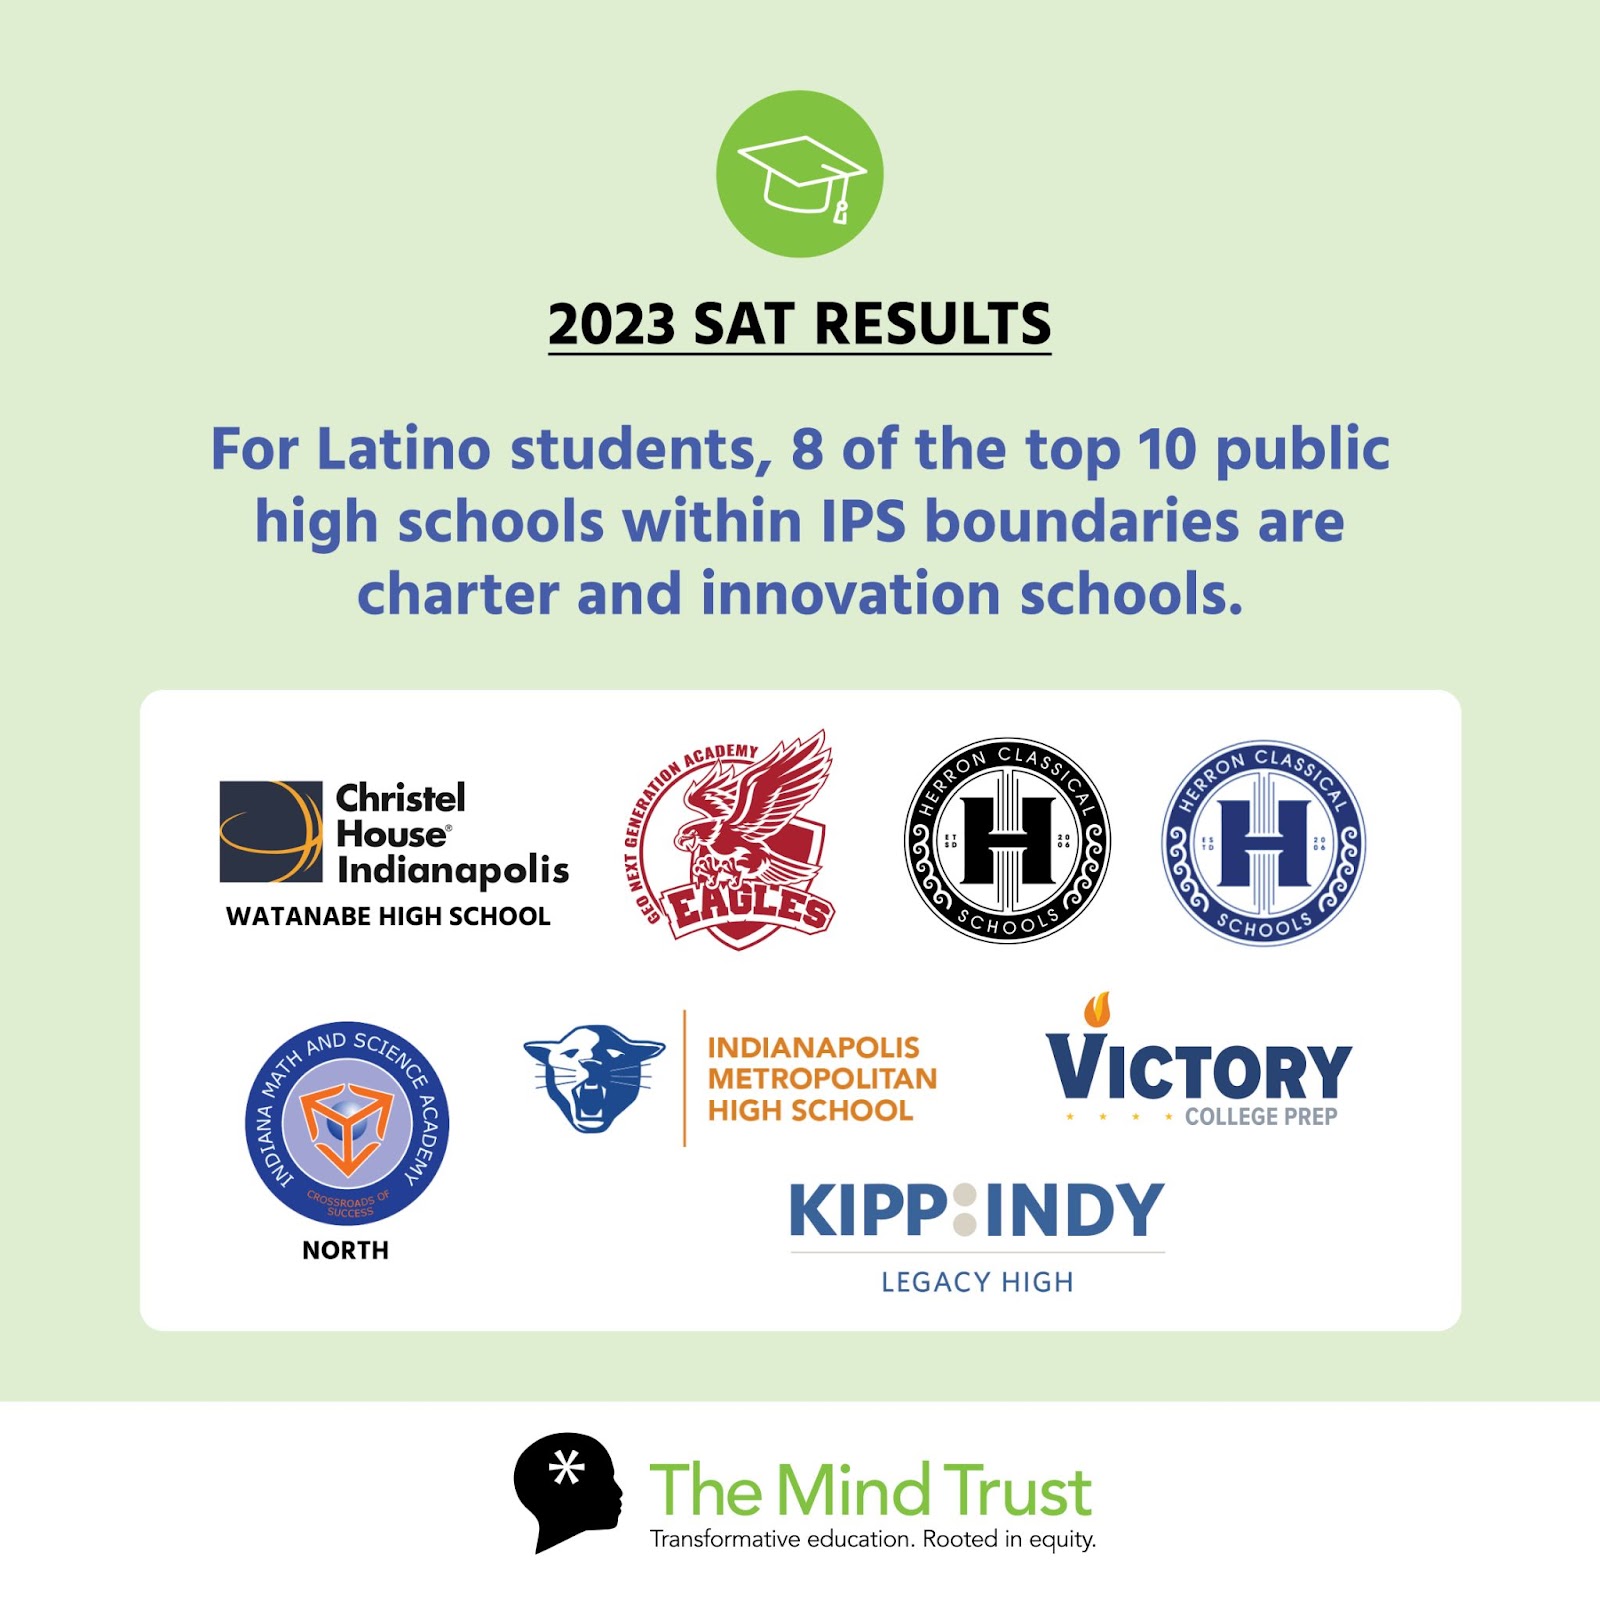
- For Hispanic students, 8 of the top 10 public high schools are charter and innovation schools.
- For Black students, 5 of the top 6 public high schools within Marion County are charter and innovation schools.
- For Hispanic students, 3 of the top 5 public high schools within Marion County are charter and innovation schools.
Highlights for innovation charter schools:
- Overall, innovation charter school college readiness rates were:
- 7.5x higher than IPS direct-run high schools
- Almost double the township average
- Higher than the state average
- For Black students, innovation charter school college readiness rates were:
- 9x higher than IPS direct-run high schools
- More than double the township average
- Higher than the state average
- For Hispanic students, innovation charter school college readiness rates were:
- 4x higher than IPS direct-run high schools
- Double the township average
- Higher than the state average
Even with the growing body of evidence that indicates charter and innovation high schools drive more academic progress than other school types, far too few Indianapolis students are prepared for college upon high school graduation. We must continue to urgently pursue strategies that will increase college attendance and persistence for Indianapolis students. Our city’s future depends on a high-quality school system that prepares all students for a life of choice.